Interest Rate Roundup

Friday, September 29, 2006

Thoughts on the new mortgage regs

Well, we finally got the new mortgage regulations/guidelines from the major federal banking regulatory agencies (Fed, OCC, etc.). My general sense after reading through page upon page of government-ese is that the regs don't change much. There's a lot of guidance and tough talk about excessive risk-taking in the lending arena. The agencies make clear they're not happy with how lenders are doling out interest only loans and option ARMs to anyone with a pulse. And they're worried that borrowers are going to suffer a massive bout of payment shock -- that's when the initial, artificially suppressed payment on an IO, ARM, or option ARM loan resets to a higher one in order to force the borrower to start paying back principal.

But it's not like any type of loan was banned. And while more pre-closing disclosure documents warning about the risk of these "Frankenstein Financing" mortgages is nice, customers are already bombarded with page after page of disclosures when they take out a loan. Are they really going to benefit from being given even MORE?

Lastly, there's the timing issue. Everyone who follows this industry, as I do, has known for a long time that too much high-risk, B.S. lending was going on. Fraud? Rampant. Outright lying about income, assets, owner occupancy status? It's everywhere. Why is it NOW, a full year after the housing market peaked (I put that at July 2005), that we're seeing the regulators step it up? I'm not really surprised, just disappointed ... because it's too late to prevent a lot of ruined lives.

Anywhere, here's an AP story covering the regulations.

Thursday, September 28, 2006

lumber update

Just FYI -- I mentioned in an earlier post that lumber prices have been tanking. My take was that the drop stemmed from the ongoing downturn in housing. When you have fewer home sales, you get fewer housing starts. That reduces demand from builders for lumber products -- wall components, crown molding, etc.

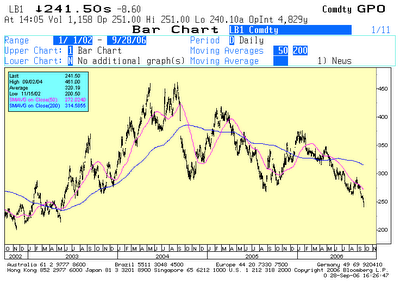
Well, lumber futures prices are really starting to tank now -- down just over 1% on 9/26, 2.1% on 9/27, and 3.4% today, according to Bloomberg. Here's a chart of the continuous contract, which shows we're now trading at lows not seen since May 2003.

HOWEVER, a Bloomberg story today attributes some of the recent decline to speculation that Canadian suppliers are trying to send more wood our way ahead of Oct. 1, when a lumber trade agreement between the U.S. and Canada is scheduled to take effect. Without getting into the nitty gritty, it seems the agreement gives Canadian producers an incentive to ship more our way. Here's some background on the accord from several months ago when it was first signed.

Just thought I'd share this latest news in case the LB futures activity is throwing off a "false" housing signal. I doubt it is, though, given the ongoing fundamental data showing weak sales, weak production, and slumping purchase mortgage activity.

Derivatives extravaganza -- $119 TRILLION!

I guess I should be jaded by now, and just ignore the numbers. But every quarter, I can't help but peruse the Office of the Comptroller of the Currency's (OCC) latest report on derivatives activity. It's not exactly beach reading. But it is, frankly, astounding to see some of the figures in these documents. The highlights of the Q2 report:

* The notional amount of outstanding derivatives held by U.S. commercial banks jumped 8% between the first and second quarter to ... drum roll please ... $119 trillion. That's also up 24% YOY. Just in case your curious, global Gross Domestic Product in 2004 was $41.4 trillion, according to the World Bank.

* Now as you may or may not know, notional value is NOT the same as the amount at risk that banks have. In OCC jargon: "The notional amount of a derivative contract is a reference amount from which contractual payments will be derived, but it is generally not an amount at risk. The credit risk in a derivative contract is a function of a number of variables, such as whether counterparties exchange notional principal, the volatility of the underlying market factors interest rate, currency, commodity, equity or corporate reference entity) used as the basis for determining contract payments, the maturity and liquidity of contracts, and the creditworthiness of the counterparties."

* So to determine "real" exposure, you want to look at various credit risk measures that allow for netting of winning and losing bets between institutions, and other compensating factors. Problem is, skyrocketing overall contract value is also pushing up "total credit exposure" -- it climbed to $1.4 trillion in Q2 from $1.31 trillion in Q1. Another measure of risk is lower. Called "Netted Current Credit Exposure," it was up $10 billion to $199 billion in Q2.

All in all, the OCC has lots of soothing language about why the gigantic growth in derivatives outstanding is not a big deal ... how the "real" possible losses are very small in relation to bank capital levels ... how complex modeling of "Value at Risk" shows that there isn't REALLY much risk of loss, etc., etc.

But like they say in war, no battle plan actually survives contact with the enemy. Even if all the reassurances are correct, and the derivatives extravaganza isn't a big deal, the RISK that it will BECOME a big deal with some black swan, unplanned event occurring down the road rises with every trillion dollars' worth of exposure you add in the system. Just some food for thought on this fine autumn day.

Wednesday, September 27, 2006

New home sales musings

The new home sales figures came out today. Lots of ways to parse the data, but here's my take:

* The reported sales gain between July and August was 4.1%. That was based on an August seasonally adjusted annual sales rate of 1.050 million units. But look at what Census did with the July SAAR of sales -- they cut it to 1.009 million from 1.072 million. Voila! A 2.1% decline turns into a 4.1% gain. I love gubmint accounting!

* What about supply? There was a tiny drop in for-sale inventory to 568,000 units in August from 570,000 in July. But July's figure was an all-time record. So not much good news there, though the "months supply at current sales pace" measure of inventory slipped slightly month-over-month.

* Median home prices dropped 1.3% year-over-year. That’s the first drop since 2003.

Lastly, as I mentioned, FORWARD indicators of sales like the MBA figures are pointing toward ongoing weakness in Septemmber.

Purchase Apps, charted

This is a chart (from Bloomberg) showing the MBA purchase apps index going back to late 2001. The trend should be clear...

A funny thing happened on the way to the lender's office

Sorry -- that's a lame attempt to devise a play on "A funny thing happened on the way to the forum." I can't help myself; it's early and I've already downed something like 40 ounces of diet, caffeine-laden cola.

Anyway, I mentioned in a post a while back that I was closely watching the interplay of mortgage rates and purchase mortgage demand. Specifically, I commented on how the Mortgage Bankers Association's purchase mortgage application index didn't seem to be responding to the decline in mortgage rates. 30-year fixed rates peaked at 6.86% in late June, according to the MBAA, and fell all the way to 6.18% in the week of September 22. That's a decline of 9.9%. Do you know what the purchase index has done in the same time frame? DROPPED from 389 to 375.90, or 3.4%. In fact, the latest reading ties the cycle low reading from the end of August.

Maybe it's nothing. Maybe things will turn around soon. But if purchase apps continue to slump DESPITE a decline in interest rates, it could be a signal this bust has more to go. I'd also note that lumber futures dropped yesterday to a fresh low -- 255.50 on the continuous contract. The only market-based indicator signaling a turn in the market's prospects is housing/mortgage stocks, which have rallied in recent weeks. Are the housing stocks "right?" Is the data "right?" Is the lumber market "right?" We'll see ...

Monday, September 25, 2006

The 2nd worst decline ever

Just to finish things off, chart-wise here, I thought I'd include a chart of the YOY% change in median single family home prices. It goes all the way back to 1970. You can see several years of middling growth (5-10%) and two gigantic peaks -- in the late 70s hyperinflationary period and in the most recent bubble.

You can also see the 1.7% decline for August 2006. That's the second-biggest drop ever, behind only November 1990.

Existing home inventory, in living color

Okay, so maybe it's not living color. It's more like "faint yellow" color, with a bit of blue thrown in for good measure. But the most important thing in this chart isn't the colors. It's the black line. It shows the number of existing, single-family homes for sale (the NAR also reports TOTAL inventory, including condos and coops, but I don't have that data going back as far).

You can see that SFH inventory is up 36% from August 2005 and a whopping 51.6% from August 2004. You can also see that we have not had anything like this explosion in supply anytime in recent history. Does this look like the makings of a soft landing to you?

Existing home ugliness

I said the August existing home sales report would tell us a lot. And boy did it ever. Some quick and dirty stats from the report:

* August existing home sales were down 0.5% MOM from July. Down 12.6% YOY from August 2005.

* The "Months supply at current sales pace" indicator of inventory came in at 7.5 months, up from 7.3 months in July and the highest since 1993. The absolute number of homes for sale increased again -- to 3.92 million units from 3.86 million in July. That's yet another record.

* Here's the real kicker -- median prices overall (condo + single family) dropped 1.7% YOY to $225,000. That's the first YOY decline in any month since April 1995, and the second worst in U.S. history.

Saturday, September 23, 2006

Key week for housing data

Just as a reminder, or a heads up for those of you who don’t know, August national existing home sales will be released this coming Monday, with August national new home sales coming out Wednesday. Fasten those seat belts because this COULD be the first time in ages we see a national median price decline across the board (condos are already negative, according to the National Association of Realtors, but SFH hadn’t crossed that threshold as of July).

One other important thing worth noting: Interest rates have fallen in the past couple of weeks, most notably long-term rates. Bonds had a big bounce price wise, and corresponding drop in yields. So now it’s gametime — DO buyers start responding to these lower rates? Will the Mortgage Bankers Association’s weekly purchase mortgage application index start RISING as rates fall (It hasn't really responded so far to the decline in rates since July)? OR does mortgage demand continue to slump despite the fall in rates because people are afraid to buy due to negative publicity, declining prices, etc. Hopefully, we’ll get answers to these questions this week.

Friday, September 22, 2006

Commercial R.E. nuttiness

I spend most of my time focused on residential real estate. But that doesn't mean I don't pay attention to what's going on in the commercial side of the business, and in particular, what the commercial REITs are doing.

Maybe I'm just crazy, but it sure looks like things are getting nutty there. I mean, some of these REIT shares are trading at P/E ratios we haven't seen in years and years. And their dividend yields? Far lower than risk free Treasuries -- like more than 100 basis points lower. In fact, some REITs are sporting their lowest indicated dividend yields ever.

Why would an income seeking investor (traditionally the kind of buyer attracted to REIT shares) take on the extra risk of owning a REIT stock instead of a Treasury Note? If the economy slows, won't demand cool for office, retail, and industrial space? And won't that cause rent growth to slow?

Anyway, I have some more thoughts posted in my weekly Money and Markets column, available here, if you're interested. Have a good weekend ...

Thursday, September 21, 2006

So much for that ...

Looks like a weak Philly Fed index was all the bond market needed to rocket today. Long bonds finished the day up 26/32 after the September reading came in at -0.4 vs. 18.5 in August. Traders ignored the prices received sub index, which ROSE to 21.6 from 17.1 (prices paid did, in fairness, decline about 7 points). In other news, new orders were weak, though the employment index popped up from the previous month.

Wednesday, September 20, 2006

The latest on bonds

Bonds had a big up day on the benign PPI report. They followed through with some gains today, but gave back a few ticks in the wake of the Federal Reserve Board statement, which you can read here. I'm not ready to give up my bearish stance yet. I still believe bond prices are stretched -- really, really stretched.

The Fed bascially just confirmed that no rate cuts are imminent ... but the deeply inverted curve is priced as if we'll get at least one, if not two, moves lower in the federal funds rate in the very near future. Credit spreads are still tight, an indication the corporate and junk bond markets aren't all that worried about the economy. And the stock market is flirting with all-time highs. Seems to me at least one of these markets has to be "wrong" about the prospects for the economy and/or interest rates.

Anyway, it'll be interesting to see how we close this week (where prices/yields settle out), now that the Fed meeting is behind us.

FDIC talks mortgage risk

Sandra Thompson of the FDIC is talking about the risk of non-traditional mortgage products ("Frankenstein Financing" in my nomenclature) before the Senate Subcommittee on Economic Policy and Subcommittee on Housing and Transportation of the Committee on Banking, Housing and Urban Affairs. Lots of scary stuff in here, if you're inclined to read the whole presentation. Among the juiciest nuggets:

On the prevelance of option-ARM and interest only lending:

"According to the publication Inside Mortgage Finance, an estimated $432 billion of interest-only loans and payment-option ARMs were originated during the first half of 2006. This represents approximately 29 percent of all mortgages originated during the same period. "

On how the bubble was fueled by risky lending, and how the bubble, in turn, fueled even more risky lending:

"The acceleration of the U.S. home price boom does appear to have been related to changes in the mortgage markets -- and causation probably runs both ways. The greater availability of flexible mortgage structures probably allowed price increases to outstrip growth in incomes to a greater extent than would otherwise have been the case. In addition, high-priced homes probably induced at least some borrowers to use interest-only or payment-option mortgages in order to afford their home."

On the results of a 2005 study by regulatory agencies (which reviewed what the nation's biggest lenders have been doing in the nontraditional mortgage arena):

"The review found indications of loosening in underwriting standards, some instances of borrowers not being qualified based on fully amortizing payments, and an increase in simultaneous second mortgages and other activities that added an additional layer of credit risk. The survey also found geographic concentrations of these products in areas experiencing rapid home price appreciation."

On the risky pratctices of today's lenders:

"Many nontraditional loan products require little or no documentation or have been accompanied by practices such as simultaneous second-lien mortgages that create additional layers of risk for lenders."

"In traditional mortgage lending, the borrower's repayment capacity, including debt-to-income ratios, has been a key underwriting consideration. However, there is growing evidence of interest-only and payment-option ARMs being made to borrowers with little or no documentation to verify income sources or financial assets."

"The combination of several liberalized underwriting terms, or "risk layering," also has become more prevalent. Lenders increasingly are providing simultaneous second-lien mortgages to cover a portion of the home purchase price. A simultaneous second-lien mortgage reduces borrowers' equity in their homes and increases borrowers' monthly debt service. When one loan combines several such features, the total risk is compounded."

I've been warning about this stuff for more than a year in our Safe Money Report newsletter, and more recently, in Money and Markets here and especially here. It's a shame the regulators didn't crack down sooner, before all this reckless lending really got out of control.

Tuesday, September 19, 2006

PPI surprise

Whoa ... that Producer Price Index number was not what I was expecting. Overall PPI rose 0.1% in August, while the core PPI (excluding food and energy) was DOWN 0.4%. It looks like a big decline in auto prices (-2.6% for passenger cars and -3.4% for light trucks) accounted for a big portion of the overall decline. Bonds liked the news, and were recently up 21/32 on the long bond future. Will the Fed weight the more bearish CPI report over the more bullish PPI? Will this change the longer-term picture for bonds? Only time will tell.

Monday, September 18, 2006

thoughts on lumber futures

Yes, lumber futures. I hope this post doesn't leave you "board" ... er ... "bored" (sorry, couldn't resist). But I keep my eye on both lumber futures and oriented strand board prices as they can give you clues about where the housing market is going. When prices are rising, it indicates that demand is rising as well. That, in turn, signals that home construction and sales are going strong. The opposite is true when prices are falling.

Anyway, in the past couple of days, lumber prices have taken another dive. They're now retesting a key technical level ($260-ish) that has held several times in the past couple of years. If it gives way, it COULD signal a new leg down in the market. Only time will tell.

It's worth noting that we'll get August housing starts figures tomorrow. A strong number could turn the price tide in lumber, while a weak number could have the opposite effect.

NAHB down again

We just got yet another decline in the National Association of Home Builders' Index, this time for the month of September. The index fell to 30 in September from 33 in August. The sub-indices for present and future single family homes fell by 5 and 4 points, respectively. Only the prospective buyers traffic sub-index held steady at 22. The overall index is at its worst level since the 1991 recession (February of that year, to be specific).

Another day, another bond market pounding

Long Bond futures are off about a half point (15/32). The catalyst: News that foreign inflows were just shy of $33 billion in July. That's less than half the market forecast. Moreover, it failed to cover July's gigantic trade deficit. The current account deficit figures for Q2 were also poor. Since we basically mortgage our economy to foreign debt holders day in, and day out, any drop off in foreign inflows into our bonds could send interest rates higher. That's why this is bad news.

Technically speaking, if the long bond contract breaks roughly 109 and a half, we could be in big trouble. I'd take that as a sign that bond prices have further to fall and interest rates have further to rise, perhaps much further, given how many speculative, hot money types have piled into Treasury futures.

Friday, September 15, 2006

Eurodollar market action


It's interesting to note the technical action in the Eurodollar futures market. If you don't know what Eurodollar futures are, I'll keep it simple: Eurodollars PRICES rise when expectations for the level of future short-term rates decline. In other words, if investors expect the Federal Reserve Board to cut short-term interest rates down the road, Eurodollar futures contracts will rise in value.

As you can see in this chart of the June 2007 ED contract, prices have been in an uptrend for several weeks. But they topped out in late August and have now broken below that uptrend line. In other words, traders are getting LESS sure that the Fed will be cutting rates anytime soon. This isn't a MAJOR move, but it's a definite change in the short-term trend and worth noting. The earlier rally off the "benign" CPI figures has petered out and now, Treasury futures are largely flat.

right numbers, wrong reaction? Or not?

Let's look at the meat of this Consumer Price Index report. It showed ...

* Core inflation, excluding food and energy, up 0.24% (just shy of being rounded up to 0.3%, incidentally) on the month. That helped push the year-over-year core inflation rate to 2.8%. Not only is that well above the Fed's unofficial 2% target, it's the single biggest increase going all the way back to March 1996.

* Several categories of goods and services showed increases. Food. Apparel. Medical care. Education and communication. They were all up. So it wasn't just oil and gas, and it wasn't just owners' equivalent rent, which some have claimed distorts the true inflation picture.

* Now, the big decline we've seen in oil and gas prices will obviously lower headline inflation in the next month. But on the way up (i.e. when inflation was rising), all I heard was how commodity price increases don't matter, how our economy was much less sensitive to oil, and that the REAL source of inflation was other things, like wage growth. Ergo, ignore the increase in inflation.

Now, we have rising wages and falling oil prices, and we're supposed to believe the opposite ... that inflation will die out because oil is down to $62.50 a barrel? I don't know. Maybe we can have it both ways. But I'm skeptical.

In the end, though, it doesn't matter what I think -- it only matters what the market thinks. And so far, Treasuries are having a modest rally on the news (11/32) recently on the long bond. Stocks are also throwing a party.

Thursday, September 14, 2006

The setup is there ...


I've been saying in various forums that bonds looked vulnerable. But what exactly am I talking about?

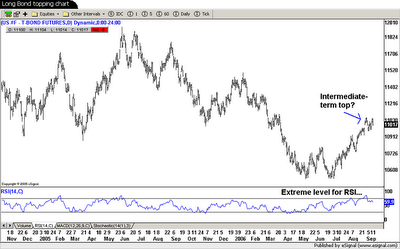
Take a look at this chart. It shows the price action in the continuous U.S. Long Bond future. You can see that long bond prices are off their lows and at a level of potential resistance. You can also see that the Relative Strength Index -- a key technical momentum indicator -- is in nosebleed territory. In fact, the last two times RSI was in this range (February and May 2005), big sell-offs ensued.

Tomorrow we get the August Consumer Price Index report. If there's even a hint of trouble in the numbers, we could see a big sell-off. Or in other words, the set-up is there for some pain. Now, the question is whether we'll get it or not.

Wednesday, September 13, 2006

More on delinquencies, foreclosures

I should have mentioned in my previous post that the Mortgage Bankers Association's quarterly delinquency and foreclosures stats came out for Q2. To summarize:

* The subprime delinquency rate jumped to 11.7% in the quarter from 11.5% in Q1 and 10.33% a year earlier. Prime delinquencies were relatively flat

* However, ARM delinquencies are climbing pretty quickly. Prime ARM delinquencies hit 2.7%, a sharp rise from 2.19% a year earlier.

* Some 0.43% of the mortgages the MBA tracks started foreclosure in the quarter. That's the highest level since Q4 2004. Prime ARM loans are going into foreclosure at the fastest rate since Q3 2002.

Say what you will about the housing market overall, it's clear that subprime borrowers and ARM borrowers are finding themselves increasingly stretched. Throw in slumping to stagnant home values and you've got a recipe for more losses among exposed lenders.

How easy lending destroys lives

I'm not going to go into too much detail here. I'll let the latest numbers from RealtyTrac speak for themselves:

* 115,292 properties fell into foreclosure in August. That's up 24% from July and 53% from August 2005.

* Florida foreclosures were the highest in the country at more than 16,500.

* Other markets that were the earliest to boom, are now proving to be the earliest to bust. And the pain is piling up. California foreclosures surged a whopping 160% from a year ago. Nevada foreclosures jumped even more -- 255%.

There was also a great story in Mother Jones magazine that talks about the neighborhood destruction that easy lending, mortgage fraud, etc. has caused in Cleveland. I hope Alan Greenspan rests easy after each $100,000 speech he gives, knowing that he didn't create a massive housing bubble (only local froth), and that he didn't encourage borrowers to take out ARMs at the absolute worst possible time in the past several years.

Overseas inflation and more thoughts on oil

Here are a couple of excerpts from Bloomberg on U.K. inflation in August (my emphasis added in bold) ...

"Consumer prices rose 2.5 percent from a year earlier, holding above the Bank of England's 2 percent target for a fourth month, the Office for National Statistics in London said today. That matched June's level, the highest since the index began in 1997, and exceeded the 2.4 percent median estimate in a Bloomberg survey of 33 economists. Prices rose 0.4 percent from July."

"Price increases in recreation and culture, clothing and footwear, furniture and household repair drove the index higher in August, the statistics office said. Those gains offset a downward effect from international airfares and transport, affected by a lower increase than last year in petrol.
Core inflation, excluding food, alcoholic beverages, tobacco and energy, quickened to 1.1 percent from 0.9 percent in July."

Now, here's what happened in China, according to AFP ...

BEIJING (AFP) - China's consumer inflation picked up pace in August, rising 1.3 percent from a year earlier as services became more expensive.

The data, marking a rise from one percent inflation in July, were announced as policy makers were still weighing the pros and cons of further tightening measures, but this figure was unlikely to force them to act, analysts said Monday.

Inflation figures in France, Germany and Spain also remained elevated, though not out of line with market expectations. The Big Kahuna -- the U.S. Consumer Price Index -- will be released on Friday.

Going forward, a major question for bonds is whether the decline in oil prices will keep overall inflation pressures contained. OR, will it help support the consumer-driven economy and keep wage and job growth stronger than it would otherwise be. The risks seem tilted toward lower bond prices and higher interest rates, from where I sit. We'll see...

Tuesday, September 12, 2006

Falling oil and gas prices -- Bullish or Bearish for bonds?

During this entire Fed-fed asset bubble cycle, crude oil and bonds have had a complex relationship with each other. Sometimes, lower crude oil (and gasoline) prices were interpreted as bearish for bonds. The reason: They helped fuel consumer spending, and by extension, economic growth. Sometimes, lower energy prices were interpreted as bullish. The reason: Lower crude prices meant less inflation pressure.

So which is it? Are lower energy prices bullish or bearish for bonds? The answer RIGHT NOW is apparently bullish. Crude futures dropped yet again, losing $1.81, and the response in the bond market was a rally -- 13/32 recently on the Long Bond future. Will this relationship hold? Is there a point at which these falling energy prices will once again be a negative for bonds? That's a question we don't know the answer to yet.

10-year auction results

The auction of 10-year Treasury notes went well today, by most measures. The $8 billion in notes were technically sold as part of a re-opening -- they have the same rates and maturity dates as the notes sold back on August 9. The bid-to-cover ratio was a hefty 2.91, well above the average 2.49 for the past 10 auctions. The notes were sold at a yield of 4.81%, slightly lower than forecast.

So buyers are still stepping up to the plate. But I simply cannot get over the nagging feeling that bonds are too rich here. Everyone is in love with 'em. They're massively leveraged long, if you believe the recent CFTC figures. Given the market's penchant for surprising the most people as often as possible, a price decline/rise in rates could be the next big, looming shock. We'll see...

Monday, September 11, 2006

Completely off-topic, but ...

I had to share something on this day, the fifth anniversary of 9/11. My oldest daughter (who just turned 4) came home from day care with an American flag made out of construction paper. I asked her what it was for -- and she said it was because today is a special day. I asked "Why?" Her answer: Because a lot of people became heroes on this day. Lots of wisdom from a little girl.

Sunday, September 10, 2006

Buy vs. Rent insanity in South FL

Good Sunday afternoon -- I hope you're all enjoying your weekend as much as I am. I don't normally post on weekends, but I just had to after reviewing our local newspaper's "Residences" section. That's the weekly real estate insert with all the local home listings.

Anyway, I've known for a long time how out of whack the overall "rent vs. buy" relationship was in my neck of the woods. You can rent many properties for 1/3 or 1/2 the cost of owning (mortgage payment + taxes + insurance + maintenance), even AFTER factoring in the tax advantages of homeownership.

But even I'm shocked at how egregiously overpriced some property appears to be, based on rent vs. buy calculations. Take a look at this advertisement for a house in Jupiter Inlet Colony, a small, tony town just north of the Jupiter Inlet here in South FL. It's a "charming 2 BR beach cottage" listed at $985,000. But the print ad in my local paper says it's "for rent or sale." How much is that rent, you ask? $2,000 a month.

Now this is where it gets fun. Let's just assume that a potential buyer can actually come up with 20% down -- or $197,000 -- and that he wants to use a 30-year fixed rate loan. We know that in today's "Frankenstein Financing" world, few people actually do buy homes that way. Instead, they're forced to use neg am loans ... option ARMs ... I/O mortgages ... 80/20 loans ... and other assorted garbage.

But again, I'm trying to be generous. Right now, a 30-year jumbo FRM (remember, you're borrowing 788,000, which puts you above the Freddie Mac/Fannie Mae conforming loan limits, thereby requiring you to get a jumbo loan), runs around 6.25%-6.5%. The payment using the lower rate -- for principal and interest only -- would be $4,852. Yes folks, that means it would cost 143% more a month to buy than rent.

But wait, as they say in the Ginsu knife ads, there's more! You'll also get the privilege of paying property taxes on this fine property. I checked the local local property appraiser's web site -- the property was last purchased for $800,000 in May 2005. 2005 taxes therefore came to $13,590, or $1,133/month. So now we're up to $5,985 a month.

And in case you haven't heard, we have hurricanes down here in Florida. Lots of 'em in recent years, in fact. So homeowners insurance is off the charts. Given that the property was built in 1957 ... and it's a stone's throw away from the ocean ... you're probably looking at something astronomical. The square footage is listed at 2,401. Assuming a $130/SF rebuild cost (what I was told is a reasonable standard here when I recently shopped for a new homeowners policy), you're looking at $312,130 in needed coverage. I'm going to take a conservative guess that such an amount of coverage in the location we're talking about for such an old house would run $6,000 a year. That's another $500/month.

Grand total: $6,485/month -- 224% more than it would cost to rent. Put another way, buying is TRIPLE the cost of renting here!

Of course, you'd be able to deduct some of the real estate taxes and mortgage interest paid as a buyer. But even factoring that in, ask yourself: Does it make financial sense by any reasonable stretch of the imagination to buy in this situation? I think we all know the answer. And this example is far from the only one here in South FL. Bottom line: Either rents (and the incomes to pay them) will have to skyrocket, or house prices will have to fall, to restore any semblance of normalcy to the market. Which do you think is more likely?
Friday, September 08, 2006

Whole lotta nothing coming out of Cleveland...

Not to insult any readers out there who may be from the fine city of Cleveland. But the comments from Cleveland Fed president Sandra Pianolto contained nothing new or surprising on the Fed front. She said "the elevated inflation numbers concerned me, and indeed they still do" but said a pause in the rate-hiking cycle was appropriate to assess the impact of past hikes. In other words, more of the same.

Bonds are up modestly today, but they were already rising in price this morning, so it doesn't look like the comments mattered much to traders. Still a whole lotta hot money longs in Treasuries. Will they ultimately prove right? We'll see, but you know my take.

Thursday, September 07, 2006

When doves cry ... "inflation"

San Francisco Fed President Janet Yellen just gave a speech to a business group in Idaho. She's one of the biggest "doves," or easy money types, on the Fed. But this time, she cried out the following: "The bottom line is this. With inflation too high, policy must have a bias toward further firming."

Now granted, she also defended the Fed's pause and said a slowing economy should bring down inflation. But this sure doesn't look like the kind of gentle talk Wall Street was looking for. And remember: The bond market is priced for perfection. Anything less (i.e. Fed language, like Yellen's, that signals rates will NOT be cut anytime soon) COULD lead to a big sell off in Treasuries. We'll see.

"string theory" and mortgage rates

I want to share a table that I just built with you ...
This shows the date that rates peaked on two kinds of mortgages (1-year ARMs and 30-year fixed rate loans). It also shows the week that the Mortgage Bankers Association's purchase mortgage application index peaked. You'll find the levels on those dates, the decline (in basis points and percent for rates, and points and percent for the MBAA index).

Anything jump right out at you? Like maybe the fact that an 8%-ish decline in rates has actually been accompanied by an 8%-ish DROP in purchase activity? There should be an INVERSE relatioship between rates and purchases, and so far, there hasn't been.

You've probably heard the expression "Pushing on a string." If you lay a string out on the ground and push one end, the other end doesn't budge. The whole thing just bends out of shape and you make no net progress.

In finance, pushing on a string refers to what sometimes happens in the wake of bursting asset bubbles. The Fed or the bond market can try to fix things (by lowering interest rates). But if borrowers don't want to borrow because they're already up to their eyeballs in debt and/or having trouble making payments ... and if lenders are so buried under bad loans, they don't make NEW credit available ... then the excess money pumping can have little impact.

This is only a nascent trend -- about 8 weeks old. And in the most RECENT week, the MBAA purchase index did pop a couple percentage points. So my "string theory" could prove wrong. But if this continues, expect a lot more trouble in housing land.

Tuesday, September 05, 2006

Does anyone NOT own 10-yr. notes here?

The bond market fundamentals are one thing. The technicals and market internals are another. This amazing chart really says it all about the third category -- internals. Courtesy of Bloomberg, it shows the "net long" position in 10-year Treasury Note futures. That's the difference between longs and shorts among large speculators, typically seen as hedge funds and other hot money types.

At more than 430,000 contracts, net longs are up 24% in a week. Moreover, as you can see, they're at the highest rate in recorded history. Contrary indicator? Time to sell bonds? Things that make you go "Hmmm..."

Saturday, September 02, 2006

Vacation's over ... time to get down to business!

I love vacations, that's for sure. Nothing like some R&R to recharge the batteries. But after the holiday weekend, it'll be time to get back to business.

In the meantime, a couple quick observations ...

1) My weeklong trip was a cruise out of Miami, Florida. Everything you've heard about how insane the condo building boom is in Miami is true. I literally counted 15 cranes throwing up buildings off the north side of the ship before we sailed out of port. There were probably another 20 or more visible to the west and southwest. And these aren't little tiny buildings going up either. Some looked to be 40 to 50 story behemoths.

The last time my wife and I were down there was in February 2004 when we took a quick trip to South Beach. The city was already getting overbuilt with empty specu-palaces back then (meaning there were several "dark towers" with only 20% or so of the units having lights on at night -- indicating flipper/investor buyers rather than owner-occupants). It is getting much, much worse now.

2) This housing bubble isn't just confined to the United States, either. There were cranes all over San Juan in Puerto Rico, too. And the bus driver on our shore excursion there couldn't stop talking about how much house prices were going up/had gone up. I'm not sure if he was just in awe/shock or looking to get a piece of the action himself. But it's telling that he brought this topic up unprompted by any of us on the tour ... and continued to talk about it for an extended period of time.

3) It looks like things got a bit more ugly in the states while I was away, too -- There was a big crash in pending home sales for July ... a big decline in construction spending ... and more trouble/downgrades in subprime lending land. I won't rehash old news, but suffice it to say, it comes as no surprise to me.

Anyway, good to be back in the saddle. Enjoy your Labor Day weekend!


Site Meter