Interest Rate Roundup

Friday, April 28, 2006

Some quick observations to mull over this weekend

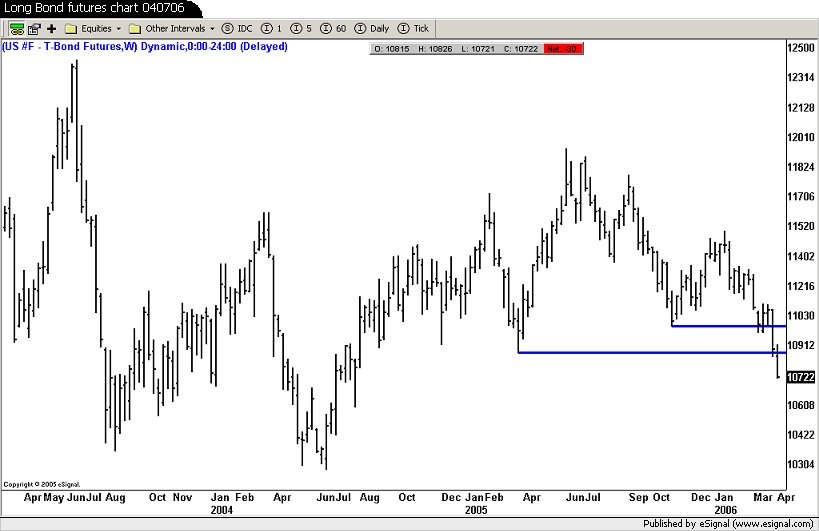
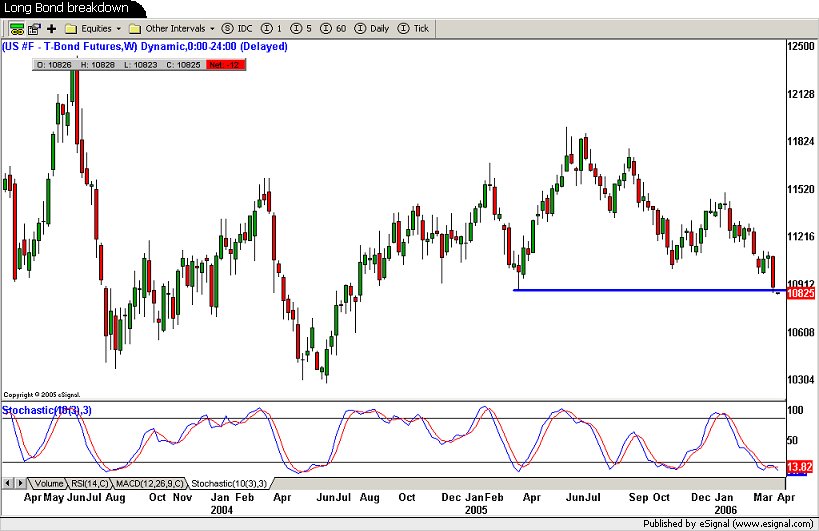
All the easy money from the Fed, the European Central Bank, and other central bankers is now causing REAL inflation problems that just can't be ignored any longer. Gold surged above $650 to a new high today. Oil is holding in the $70+ range. Gas is at $3 in many parts of the country. Copper just hit an all-time high. Zinc hit an all-time high. Silver jumped the most in 11 years today, and is just shy of a multi-decade high. The yield spread between 10-year TIPS and 10-year traditional Treasuries is at its highest in a year and climbing.

Then, you’ve got airlines hiking airfares. Shippers are hiking shipping rates. Hotels are charging more for rooms. Utility bills are rising. The list goes on and on. Even the totally cooked CPI numbers are showing signs of stress, with the beloved core rate up the most in a year last month.

Add to that the fact the dollar is now plunging in the wake of “Gentle Ben’s” ridiculous talk about “well-contained” inflation, and I think you’re getting close to a breaking point. The bond vigilantes are FINALLY waking up and taking long rates up. So even if the Fed pauses, it may NOT help housing and not keep overall rates from rising. Something to ponder over the weekend, I suppose.

Thursday, April 27, 2006

The TRUTH on the latest housing figures...

Don't be misled by this week's housing numbers. The seasonally adjusted sales rates for both new and existing homes in March topped expectations. So is this bubble talk a bunch of hogwash? Hardly. Consider the devilish details of the latest housing reports ...

Used home sales actually dropped 0.7% from a year earlier, even though they rose from February to April. More importantly, for-sale inventory jumped 39.1% YOY. At 3.19 million units, inventory is the highest in U.S. history. I don't know about you, but when I see supply jump more than 39% and demand slip slightly, I see a market that's in a heap of trouble. Meanwhile, median price growth rates are decelerating fast.

So what about new homes? Well, the increase in the sales rate for March barely offset the drops in January and February. YOY, sales dropped more than 6%. And for-sale inventory set yet another all-time high (this has been happening month in and month out). Lastly, builders were only able to move homes by cutting prices. The median price of a new home DROPPED 2.2%
year-over-year to $224,200. Average prices fell 3.6% to $279,100.

There are lies, damn lies, and statistics. And in this case, the statistics the headline writers looked at do NOT tell the real story.

Tuesday, April 25, 2006

The bond beatings will continue until morale improves

When the bond market gets a head of steam, it takes a LOT to stop it. And so far, there's no sign of a let up in the rising yield/falling price trend in Treasuries. 30-year yields jumped another 9 basis points, while September Long Bond futures prices dropped almost a full point. The catalyst today was stronger-than-expected consumer confidence, and a slightly-less-awful than expected existing home sales report. Regardless of the "cause," the effect is simple: Bondholders are losing money fast.

Thursday, April 20, 2006

Another mortgage warning from the OCC

Check out this speech (given today in Los Angeles) if you have time:
http://www.occ.treas.gov/ftp/release/2006-48a.pdf

It's yet another shot over the bow of high-risk mortgage lenders, this time from John Dugan, Comptroller of the Currency. The OCC (as his banking regulatory agency is known) is one of several that oversee operations at U.S. financial institutions. They've all been warning about the risk of today's super-high-risk loans.

What concerns them? Interest only financing and "option adjustable rate mortgages" allow you to get into a home with minimal payments up front. But those monthly payments are GUARANTEED to shoot up later on.

Why? You get to pay only the interest due for a few years (sometimes 3, sometimes 5 or more). But you have to eventually start paying principal. Since that principal is amortized (or divided) over a shorter period of time (say, 25 years vs. 30), your monthly costs jump EVEN IF RATES STAY FLAT. If they rise -- like they've been doing for almost two years now -- and you have an adjustable IO loan, your payment jumps even more.

As for option ARMs, they're even worse. You get to "choose" your payment: a normal 30-year-fixed-type payment, an interest only payment or a payment that doesn't even cover all the interest due each month. The problem is, WAY too many of today's overstretched borrowers are making just the minimum payment. When you do that, your unpaid interest gets tacked on to your loan principal. That means your balance goes UP over time, not down (a phenomenon called "negative amortization"). And guess what? You have to pay the INCREASED balance back ... over a shorter amortization period ... at a higher interest rate. Result: Your payments can as much as DOUBLE.

This kind of ridiculous financing is what helped inflate the housing bubble. Regulators were asleep at the switch for far too long, but they're finally doing something now. That will likely cause lending standards to tighten up, helping exacerbate the housing market slowdown. Soft landing? Not bloody likely!

Quick hits...

Sorry for the absence these past few days. I actually took a vacation, then had computer issues. But now that I'm back in the saddle, here are a couple quick thoughts ...

1) Looks like we're having about the 5th "The Fed is done hiking rates" rallies in the stock market. I suppose even a stopped clock is right twice a day. But when are these rocks-for-brains "expert" economists on Wall Street going to give it up. How come they have any credibility left? Just wondering.

2) Nasty Consumer Price Index numbers yesterday. Headline CPI showed a big jump (0.4%). But even the artificially depressed/massaged/ridiculous "core" CPI (that excludes those things none of us use, like food and gasoline) jumped 0.3%. That was the biggest monthly gain in a year. For a "data dependent" Fed, these numbers should be the kiss of death.

3) $71 oil. $620 gold (after today's correction). Surging aluminum, zinc, platinum, copper, etc. prices. Yep, no inflation here.

4) Housing stats falling off a cliff, with the latest (April) National Association of Home Builders' index reading of 50 the lowest since November 2001. Exclude the post-9/11 figures, and you have to go back to 1996 to find numbers that are worse.

Of course, this is only more concrete proof that the real estate shills are right about a "soft landing." (Yes, I'm saying that with my tongue firmly planted in my cheek)

Wednesday, April 12, 2006

A housing anecdote to share ...

I'm a statistics guy. I follow all the national numbers when it comes to the housing market. But I've also been running my own "anecdotal" research in my area. Every few days since June 2005, I've been running a query on Realtor.com, the listings website. I go in and ask "How many homes with at least 2 bedrooms and 2 baths are for sale in my zip code -- 33458 -- for between $100,000 to $500,000?"

The numbers:
6/15/2005 -- 150
4/12/2006 -- 540
Difference: +260%

Put another way, for-sale inventory in my price range ... in my town ... has almost QUADRUPLED in less than a year. Meanwhile, sales region-wide (I don't have zip-code only sales) were off 22% year-over-year in February (for existing single family homes) and 14% for condos. Does this sound like the makings of a soft landing to you?

WSJ: Hot housing markets go cold ... fast

I've been shouting from the rooftops that the housing market is toast ... that sales are going to slump and prices follow ... and that many neophyte real estate "investors" (and I use that term VERY loosely) are going to get their heads handed to them. So I want to make sure you don't miss today's Wall Street Journal story (subscription required) with the headline: "Hot Homes Get Cold"

In short, it chronicles how there's a massive build up in inventory on the market, how so-called investors are trying to dump their overpriced properties, and how buyers are finally wising up and telling sellers to take a hike. Forget what the National Association of Realtors might say -- this is a bloodbath in the making, not a "soft landing."

Monday, April 10, 2006

Inflation data -- coming soon to a market near you!

Bonds are taking a breather today after an ugly week. The next major catalyst? Probably March inflation numbers. Import/export prices up first on April 13, followed by PPI on April 18 and CPI on April 19.

The headline inflation figures should look pretty nasty given the March surge in oil and gasoline prices. But the Fed pretends that oil and food costs don't matter (which makes perfect sense, of course. Who drives, eats, ships packages, flies in planes, uses electricity, heats their homes, or does anything else that involves energy use? Yes, I'm being purposefully irreverent and facetious). So it's the "core" PPI and CPI that'll matter most.

I'm guessing even the core PPI will look ugly since virtually every commodity under the sun has been surging in price. CPI? Tough to say. In the real world, it's more expensive to get by each and every month. In the CPI world, who knows?

Friday, April 07, 2006

Dive ... Dive ... Dive


The bond market is starting to look like one of those old WWII submarine movies -- the ones where you have the guy shouting: "Dive ... Dive ... Dive." Prices are in free-fall, with waves of selling coming one after the other.

The Long Bond is down almost a full point in price, while 10-year T-Note yields have breached technical resistance and are at levels unseen since mid-2002. This chart shows the long bond futures, which appear to have nothing but air under them until the 103-and-change level.

Yield climb continues...

Another day, another rise in interest rates (at least so far). The catalyst: This morning's jobs report. Nonfarm payroll growth was a bit hotter than expected (211,000 in March vs. the 190,000 forecast). Also, the unemployment rate dropped 0.1% to 4.7% (vs. a forecast of 4.8%). Wage growth on the month was a touch slower than forecast. But all in all, this report solidifes the likelihood of more Fed rate hikes. Long bond yields just cracked 5% -- the first time that's happened since August 2004.

Thursday, April 06, 2006

Long, Long-term Bond chart


Regardless of the short-term trend for bond prices, this long bond monthly YIELD chart is very telling. You can see that we're currently testing and/or breaking through a super-long-term downtrend. I've drawn that trendline from the 1994 peak in yields through the pre-bubble-blow-up 1999 peak and the April 2004 peak.

Tough to say what will happen after 8:30 tomorrow, when the March employment report will hit. But it's possible that yields are making a bona fide, major break to the upside. And that should get the market's attention.

Wednesday, April 05, 2006

Junkiest junk bond surge

Oh man. Just when I thought I'd seen it all, Bloomberg publishes a story reading "Hard Rock Park, Jostens Lead Sales of Riskiest Debt" The nitty-gritty: Junk bond sales by companies rated CCC or lower (i.e. one step away from defaulting) totaled $20 billion since December. That's the most Bloomberg has ever found (they've been tracking since 1999). It's also QUADRUPLE the levels of a year ago. Yield spreads over Treasuries (an indication of how "risk" is being priced into junk bonds) are the tightest since 1997, according to Merrill Lynch.

Am I the only one out there who realizes this is patently insane? Debt buyers are getting nowhere near the compensation they should get on risky bonds. They're paying out the wazoo for bonds from companies that are virtually guaranteed to default down the road. It's just one more symptom of the Fed's "easy money for everyone" policy. And it's setting us up for a massive train wreck down the road. Ugh.

NAR: Rampant housing speculation

Stunning new stats just came out on the 2005 housing market, courtesy of the National Association of Realtors. The NAR's findings -- 40% of ALL home purchases last year were for investment (27.7%) or were vacation home buys (12.2%). The combined second home share is up from 36% a year earlier and the highest ever.

Why is this so troubling? "Primary" homeowners, or those who own a single home purchased purely as a place to live, are the most stable kind of owner. They will do everything possible to stay in their homes despite rising rates, ballooning for-sale inventories, etc. BUT when you have 4 out of 10 buyers purchasing for fun (vacation homes) or profit (investment), you have a very unstable base.

They’re not going to sit there and watch the market head south. They’re going to run for the hills -- eventually listing their properties at fire-sale prices. Chalk it up as yet another reason to worry about the long-term housing market trend.

Tuesday, April 04, 2006

Banking risks rising: FDIC

The FDIC just released its latest regional and state-by-state bank performance report. Some key statements from the release announcing the report can be found below (with areas of particular interest bolded by me)

"Moderate to strong job growth across much of the nation is helping to support loan growth and credit quality at federally insured banks and thrifts," said FDIC Chief Economist Richard A. Brown. "However, heavy dependence on mortgage and construction lending is making some banks more vulnerable to regional downturns in real estate activity."

In today's report, FDIC analysts noted that while average U.S. home prices increased at a double-digit rate for the second consecutive year, rising inventories and slowing sales point to possible moderation in housing activity for the remainder of 2006. Analysts also noted rapid growth in commercial real estate (CRE) and construction and development (C&D) lending and higher concentrations of these loan types as a percent of capital.

The bottom line is this: The nation's banks are loaded to the gills with real estate loans -- both residential and commercial. Right now, bank stock investors don't seem to care. They're paying attention to every little word out of the Fed, waiting for someone to say, in effect, "We're done tightening. You can go ahead and buy everything in sight." But with the housing market already going over a cliff, and commercial real estate valuations stretched to the max, the risk of real credit problems down the road is building.

The big Kahuna: Friday's jobs report

Treasuries are bouncing a bit today in price after 10-year yields tested highs dating back to early 2004. But this looks like nothing more than "noise." Bonds likely won't go much of anywhere before this Friday. That's when we get the big Kahuna ... the March jobs report. The Briefing.com consensus for nonfarm payrolls is a gain of 190,000. The forecast unemployment rate: 4.8%, with average hourly earnings up 0.3%. Any significant deviation above or below those targets could cause a major move in bonds.

Monday, April 03, 2006

$2 Trillion House of Pain

USA Today had a great story on a real problem facing the sickly housing market: Adjustable Rate Mortgage resets.

In a nutshell, an estimated $2 TRILLION in ARMs are seeing their rates and payments adjust higher this year and in 2007. That's about a quarter of all mortgages outstanding. Too many fools bought too-high priced homes in the too-speculative real estate boom. Now, they're going to get creamed as their monthly payments rise 20% .. 30% ... 50% or more. Ugh.

As an aside, it's amazing to me that just a few years after the dot-com bubble burst, people were so easily swept up in the housing bubble. Doesn't anyone have half a brain anymore?

Bond market pounding continues ...


It was a bad week for bonds, with key support around the 109 level cracking. What's going on? Traders are finally pricing in inflation risk ... real, genuine inflation risk. Up until now, long-term rates have failed to move up as much as short-term rates. Traders were operating on the assumption the Fed's rate hikes would "bite" -- slow the economy enough that long-term bonds would do okay.

But last week, the Fed finally acknowledged that it's more than just oil prices driving inflation higher. That's putting real fear in the long end of the curve. So is the ongoing rally in gold, oil, copper, and other commodities this morning.

This long bond futures chart shows just how far bonds could fall IF this is a new leg down. Next major support isn't until the 103 level. As always, we'll see what happens.


Site Meter