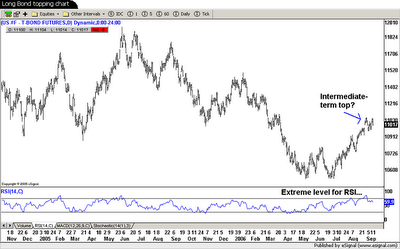
The setup is there ...

I've been saying in various forums that bonds looked vulnerable. But what exactly am I talking about?
Take a look at this chart. It shows the price action in the continuous U.S. Long Bond future. You can see that long bond prices are off their lows and at a level of potential resistance. You can also see that the Relative Strength Index -- a key technical momentum indicator -- is in nosebleed territory. In fact, the last two times RSI was in this range (February and May 2005), big sell-offs ensued.
Tomorrow we get the August Consumer Price Index report. If there's even a hint of trouble in the numbers, we could see a big sell-off. Or in other words, the set-up is there for some pain. Now, the question is whether we'll get it or not.

0 Comments:
Post a Comment
<< Home